Fájl:White noise spectrum.png
Ugrás a navigációhoz
Ugrás a kereséshez
Nem érhető el nagyobb felbontású változat.
White_noise_spectrum.png (800 × 600 képpont, fájlméret: 5 KB, MIME-típus: image/png)
Összefoglaló
| Leírás |
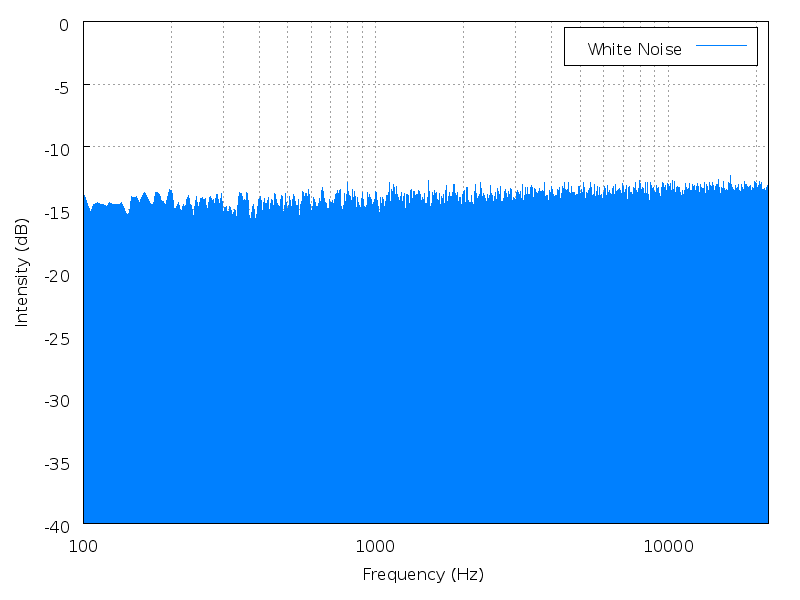
English: Spectrum analysis of uncompressed source for . Note the logarithmic frequency scale.
The analysis was done using Audacity, and plotting with gnuplot. Transparency was touched up in GIMP to make the graph background pure white. (I find the log frequency plot here confusing, as it suggests that white noise may rise slightly with increasing frequency. A linear frequency scale would be better. However, for comparison with pink noise, having the log frequency plot keeps the frequency axis on both the same.)Русский: Спектр белого шума |
| Dátum | |
| Forrás | A feltöltő saját munkája |
| Szerző | Javg (vitalap · szerkesztései) |
| Más változatok |
|


|
Ez a kép elérhető vektorgrafikus (SVG) változatban is. Ha jobb minőségű, azt használd e helyett a raszterkép helyett.
File:White noise spectrum.png → File:White noise spectrum.svg
A vektorgrafikáról a Help:SVG oldalon találsz információkat. |
 |
Instructions
Obtain the frequency analysis from Audacity, set the maximum number of windows, and use a Hamming window. The following script was used to generate the image:
Licenc
| Én, a szerző, ezt a művemet ezennel közkinccsé nyilvánítom. Ez a világ minden részén érvényes. Egyes országokban ez jogilag nem lehetséges. Ha így van, akkor: Jogot adok bárkinek, hogy bármilyen célból, feltétel nélkül használhassa ezt a fájlt, kivéve a törvény által kötelezően előírt feltételeket. |
Fájltörténet
Kattints egy időpontra, hogy a fájl akkori állapotát láthasd.
| Dátum/idő | Bélyegkép | Felbontás | Feltöltő | Megjegyzés | |
|---|---|---|---|---|---|
| aktuális | 2006. november 26., 13:54 | | 800 × 600 (5 KB) | wikimediacommons>Javg | == Summary == Spectrum analysis of uncompressed source for {{Audio|White noise.ogg|10 seconds of white noise}}. Note the logarithmic frequency scale. The analysis was done using Audacity, and plotting with gnuplot. Transparency was touched up in |
Fájlhasználat
Az alábbi lap használja ezt a fájlt: