Fájl:Prime number theorem ratio convergence.svg
Ugrás a navigációhoz
Ugrás a kereséshez

Ennek a(z) SVG fájlnak ezen PNG formátumú előnézete: 250 × 160 képpont. További felbontások: 320 × 205 képpont | 640 × 410 képpont | 1 024 × 655 képpont | 1 280 × 819 képpont | 2 560 × 1 638 képpont.
Eredeti fájl (SVG fájl, névlegesen 250 × 160 képpont, fájlméret: 87 KB)
Összefoglaló
| Leírás |
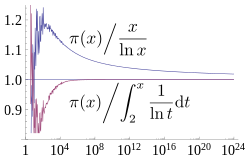
English: A plot showing how two estimates described by the prime number theorem, and converge asymptotically towards , the number of primes less than x. The x axis is and is logarithmic (labelled in evenly spaced powers of 10), going up to 1024, the largest for which is currently known. The former estimate converges extremely slowly, while the latter has visually converged on this plot by 108. Source used to generate this chart is shown below. |
| Dátum | |
| Forrás | A feltöltő saját munkája |
| Szerző | Dcoetzee |
| SVG kód |


Licenc
Én, e mű szerzője a művemet az alábbi licenc alatt teszem közzé:
| Ez a fájl a Creative Commons CC0 1.0 Univerzális Közkincs nyilatkozat alapján használható fel. | |
| Az a személy, aki ezen nyilatkozat hatálya alá helyezett egy művet, az egész világon lemondott minden, a szerzői jogi törvény szerinti műhöz fűződő jogáról, beleértve az összes kapcsolódó és szomszédos jogot is, a jogszabályokban megengedett mértékig. Ezzel a művet közkinccsé nyilvánította. Ezt a művet szabadon másolhatod, módosíthatod, terjesztheted vagy előadhatod, akár üzleti célból is, mindezt anélkül hogy engedélyt kellene kérned.
|
Source
All source released under CC0 waiver.
Mathematica source to generate graph (which was then saved as SVG from Mathematica):
(* Sample both functions at 600 logarithmically spaced points between \
1 and 2^40 *)
base = N[E^(24 Log[10]/600)];
ratios = Table[{Round[base^x],
    N[PrimePi[Round[base^x]]/(base^x/(x*Log[base]))]}, {x, 1,
    Floor[40/Log[2, base]]}];
ratiosli =
  Table[{Round[base^x],
    N[PrimePi[
       Round[base^x]]/(LogIntegral[base^x] - LogIntegral[2])]}, {x,
    Ceiling[Log[base, 2]], Floor[40/Log[2, base]]}];
(* Supplement with larger known PrimePi values that are too large for \
Mathematica to compute *)
LargePiPrime = {{10^13, 346065536839}, {10^14, 3204941750802}, {10^15,
     29844570422669}, {10^16, 279238341033925}, {10^17,
    2623557157654233}, {10^18, 24739954287740860}, {10^19,
    234057667276344607}, {10^20, 2220819602560918840}, {10^21,
    21127269486018731928}, {10^22, 201467286689315906290}, {10^23,
    1925320391606803968923}, {10^24, 18435599767349200867866}};
ratios2 =
  Join[ratios,
   Map[{#[[1]], N[#[[2]]]/(#[[1]]/(Log[#[[1]]]))} &, LargePiPrime]];
ratiosli2 =
  Join[ratiosli,
   Map[{#[[1]], N[#[[2]]]/(LogIntegral[#[[1]]] - LogIntegral[2])} &,
    LargePiPrime]];
(* Plot with log x axis, together with the horizontal line y=1 *)
Show[LogLinearPlot[1, {x, 1, 10^24}, PlotRange -> {0.8, 1.25}],
 ListLogLinearPlot[{ratios2, ratiosli2}, Joined -> True],
 LabelStyle -> FontSize -> 14]
LaTeX source for labels:
$$ \left.{\pi(x)}\middle/{\frac{x}{\ln x}}\right. $$
$$ \left.{\pi(x)}\middle/{\int_2^x \frac{1}{\ln t} \mathrm{d}t}\right. $$
These were converted to SVG with [1] and then the graph was embedded into the resulting document in Inkscape. Axis fonts were also converted to Liberation Serif in Inkscape.
Fájltörténet
Kattints egy időpontra, hogy a fájl akkori állapotát láthasd.
| Dátum/idő | Bélyegkép | Felbontás | Feltöltő | Megjegyzés | |
|---|---|---|---|---|---|
| aktuális | 2013. március 21., 14:07 | | 250 × 160 (87 KB) | wikimediacommons>Dcoetzee | Change n to x to match article |
Fájlhasználat
Az alábbi lap használja ezt a fájlt: